New Product Business Plan Template

Sample of Document Content
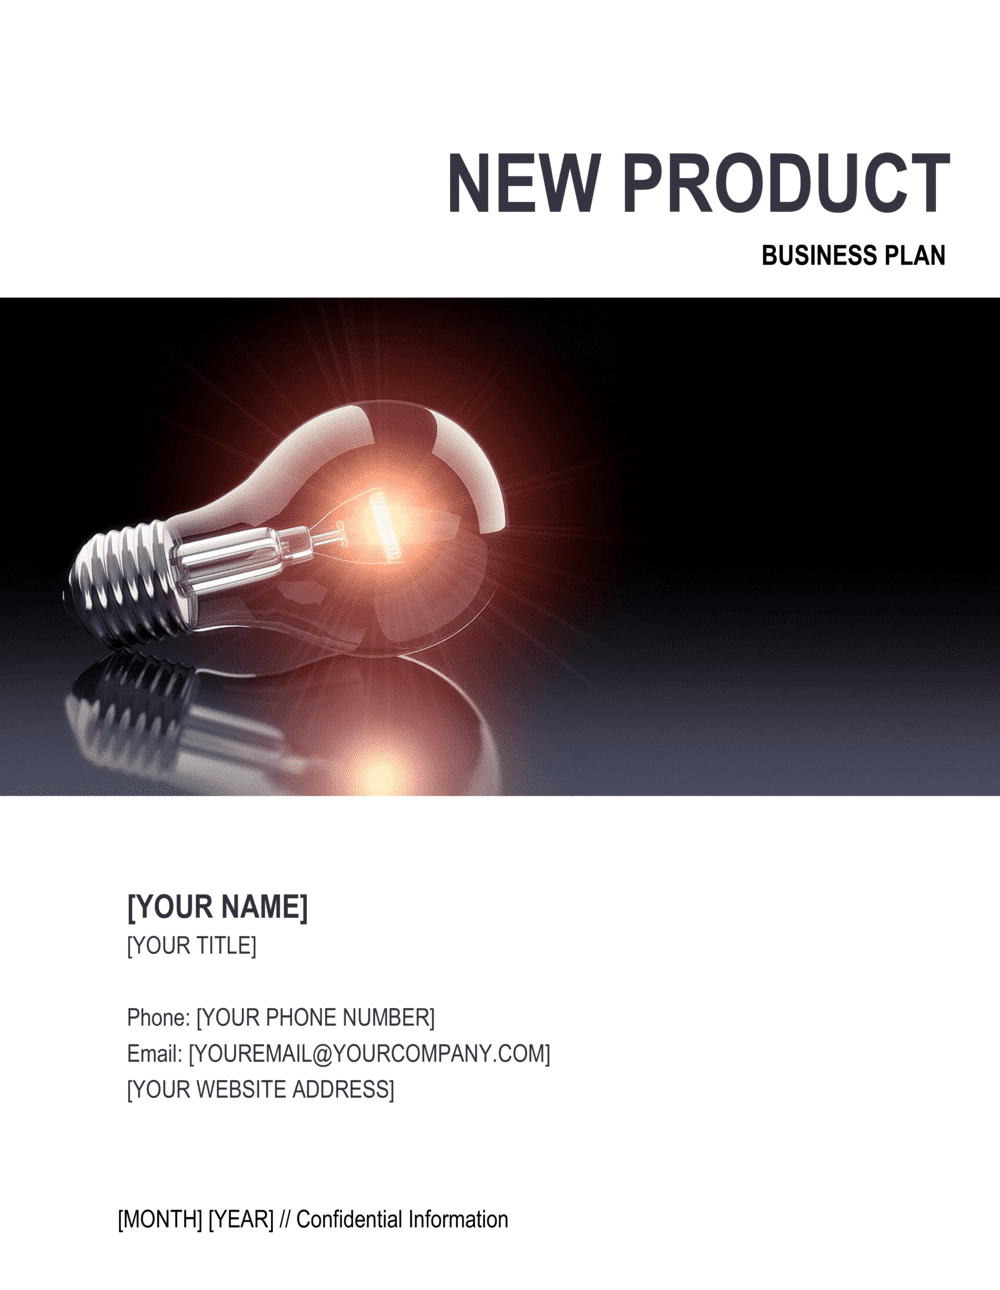
This new product business plan template has 34 pages and is a MS Word file type listed under our business plan kit documents.
New product business plan template
Confidentiality Agreement The undersigned reader acknowledges that the information provided by [YOUR COMPANY NAME] in this business plan is confidential; therefore, reader agrees not to disclose it without the express written permission of [YOUR COMPANY NAME]. It is acknowledged by reader that information to be furnished in this business plan is in all respects confidential in nature, other than information which is in the public domain through other means and that any disclosure or use of same by reader may cause serious harm or damage to [YOUR COMPANY NAME]. Upon request, this document is to be immediately returned to [YOUR COMPANY NAME]. ___________________ Signature ___________________ Name (typed or printed) ___________________ Date This is a business plan. It does not imply an offering of securities. 1.0 Executive Summary 1 Chart: Highlights 1 1.1 Objectives 2 1.2 Mission 2 1.3 Keys to Success 3 2.0 Company Summary 3 2.1 Company Ownership 3 2.2 Company History 3 Table: Past Performance 4 Chart: Past Performance 5 3.0 Products 5 4.0 Market Analysis Summary 6 4.1 Market Segmentation 7 Table: Market Analysis 7 Chart: Market Analysis (Pie) 8 4.2 Target Market Segment Strategy 8 4.3 Industry Analysis 8 4.3.1 Competition and Buying Patterns 9 5.0 Web Plan Summary 9 5.1 Website Marketing Strategy 9 5.2 Development Requirements 9 6.0 Strategy and Implementation Summary 9 6.1 SWOT Analysis 10 6.1.1 Strengths 12 6.1.2 Weaknesses 12 6.1.3 Opportunities 12 6.1.4 Threats 12 6.2 Competitive Edge 12 6.3 Marketing Strategy 12 6.4 Sales Strategy 13 6.4.1 Sales Forecast 13 Table: Sales Forecast 14 Chart: Sales Monthly 15 Chart: Sales by Year 16 6.5 Milestones 16 Table: Milestones 16 7.0 Management Summary 17 7.1 Personnel Plan 17 Table: Personnel 17 8.1 Important Assumptions 18 8.2 Break-even Analysis 18 Table: Break-even Analysis 19 8.3 Projected Profit and Loss 19 Table: Profit and Loss 20 Chart: Profit Monthly 21 Chart: Profit Yearly 21 Chart: Gross Margin Monthly 22 Chart: Gross Margin Yearly 22 8.4 Projected Cash Flow 23 Table: Cash Flow 23 Table: Cash Flow (Continued) 24 Chart: Cash 24 8.5 Projected Balance Sheet 25 Table: Balance Sheet 25 8.6 Business Ratios 25 Table: Ratios 26 Table: Sales Forecast 1 Table: Personnel 2 Table: Profit and Loss 3 Table: Cash Flow 4 Table: Balance Sheet 5 1.0 Executive Summary [YOUR COMPANY NAME] was formed in 1996 by [YOUR NAME] in [YOUR STATE/PROVINCE]. [YOUR COMPANY NAME]'s patented eco-safe INSERT PATTENED PRODUCT helps INSERT THE PURPOSE OF PRODUCT. [YOUR NAME], after completing research through patenting through full regulatory compliance now needs the resources to attain market exposure, acceptance and demand, so factories and their dealers make the "market ready products." [YOUR COMPANY NAME] envisions a collaborative effort with its factories and their dealers toward compatible goals in the agriculture trade. EXPLAIN PATTENED PRODUCT BENEFITS, ADVANTAGES, AND IMPORTANCE TO ITS INDUSTRY The focus of this business plan is to put forth objectives to work efficiently and effectively and expand internal operations, giving the Company the opportunity to grow. [YOUR COMPANY NAME] is ready to elevate to the next step(s). The Company is seeking grant funding in the amount of $1,000,000. The grant funding will be used to launch its sales and marketing phase of its business, to benefit all peoples' environments and needs worldwide. Chart: Highlights 1.1 Objectives [YOUR COMPANY NAME]'s objectives are: 1. To attain visibility of [YOUR COMPANY NAME]'s additive via typical media tools but specific to the Agricultural community 2. Pull through marketing to farmers. 3. Media presence in National and World Ag. publications, high class Web Site and Face book 4. Select regional and national distributors who promote and market to dealers 1.2 Mission [YOUR COMPANY NAME]'s Mission is to provide all the world's crop plants with [YOUR NAME]'s additive. INSERT REST OF MISSION STATEMENT. 1.3 Keys to Success [YOUR COMPANY NAME]'s keys to success are: 1. Attain visibility of the availability of [YOUR NAME]'s additive for the Agricultural community and the recognition the users will attain as better stewards of the environment 2. Highly trained sales agents in key markets 3. Personal relationship with major fertilizer producers and their farm service dealers 4. Patent protection for marketers of [YOUR NAME]'s additive 5. Demonstration sales via agricultural dealers to farms as sales training for showing yield benefits to farms from complying with environmental laws 2.0 Company Summary [YOUR COMPANY NAME] Owner: [YOUR NAME] [YOUR ADDRESS] Phone: [YOUR PHONE NUMBER] Email: [YOUREMAIL@YOURCOMPANY.COM] [YOUR COMPANY NAME]'s patented product is the DESCRIBE PATTENED PRODUCT. INSERT COMPANY'S BACKGROUND 2.1 Company Ownership [YOUR COMPANY NAME] is an INSERT LOCATION C-Corporation formed by [YOUR NAME]. The Company was incorporated in 1996. It is 100% controlled by [YOUR NAME]. [YOUR NAME] is responsible for all administrative and operational aspects of [YOUR NAME]'s business. 2.2 Company History INSERT HISTORY Table: Past Performance Past Performance 2008 2009 2010 Estimated Sales $14,538 $7,800 $26,250 Gross Margin $5,151 $2,764 $9,301 Gross Margin % 35.43% 35.44% 35.43% Operating Expenses $38,635 $19,042 $25,560 Balance Sheet 2008 2009 2010 Current Assets Cash $0 $35 $35 Other Current Assets $0 $18,000 $6,750 Total Current Assets $0 $18,035 $6,785 Long-term Assets Long-term Assets $0 $288,682 $288,682 Accumulated Depreciation $0 $91,399 $102,943 Total Long-term Assets $0 $197,283 $185,739 Total Assets $0 $215,318 $192,524 Current Liabilities Accounts Payable $0 $1,057 $1,418 Current Borrowing $0 $0 $0 Other Current Liabilities (interest free) $0 $744,169 $737,273 Total Current Liabilities $0 $745,226 $738,691 Long-term Liabilities $0 $0 $0 Total Liabilities $0 $745,226 $738,691 Paid-in Capital $0 $1,000 $1,000 Retained Earnings $0 ($514,630) ($530,908) Earnings $0 ($16,278) ($16,259) Total Capital $0 ($529,908) ($546,167) Total Capital and Liabilities $0 $215,318 $192,524 Other Inputs Payment Days 0 30 30 Chart: Past Performance 3.0 Products So far, [YOUR COMPANY NAME]'s work has resulted in a new product. DESCRIBE PRODUCT AND ITS USE 4.0 Market Analysis Summary The United States Department of Agriculture (USDA) reports (August 10, 2010 www.ers.usda.gov/Data/AgProductivity/ ) the following: "It is widely agreed that increased productivity is the main contributor to economic growth in U.S. agriculture. This data set provides estimates of productivity growth in the U.S. farm sector for the 1948-2008 period, and estimates of the growth and relative levels of productivity across the States for the period 1960-2004. The level of U.S. farm output in 2008 was 158 percent above its level in 1948, growing at an average annual rate of 1.58 percent. Aggregate input use increased a mere 0.06 percent annually, so the positive growth in farm sector output was very substantially due to productivity growth. This contrasts with a 3.6-percent annual output increase in the private nonfarm sector, with productivity growth accounting for a little more than a third of the economic growth. But what exactly is productivity? Single-factor measures of productivity, such as corn production per acre (yield or land productivity) or per hour of labor (labor productivity); have been used for many years because the underlying data are often easily available. While useful, such measures can also mislead. For example, yields could increase simply because farmers are adding more of other inputs, such as chemicals, labor, or machinery, to their land base
Reviewed on

Sample of Document Content
This new product business plan template has 34 pages and is a MS Word file type listed under our business plan kit documents.
Sample of our new product business plan template:
Confidentiality Agreement The undersigned reader acknowledges that the information provided by [YOUR COMPANY NAME] in this business plan is confidential; therefore, reader agrees not to disclose it without the express written permission of [YOUR COMPANY NAME]. It is acknowledged by reader that information to be furnished in this business plan is in all respects confidential in nature, other than information which is in the public domain through other means and that any disclosure or use of same by reader may cause serious harm or damage to [YOUR COMPANY NAME]. Upon request, this document is to be immediately returned to [YOUR COMPANY NAME]. ___________________ Signature ___________________ Name (typed or printed) ___________________ Date This is a business plan. It does not imply an offering of securities. 1.0 Executive Summary 1 Chart: Highlights 1 1.1 Objectives 2 1.2 Mission 2 1.3 Keys to Success 3 2.0 Company Summary 3 2.1 Company Ownership 3 2.2 Company History 3 Table: Past Performance 4 Chart: Past Performance 5 3.0 Products 5 4.0 Market Analysis Summary 6 4.1 Market Segmentation 7 Table: Market Analysis 7 Chart: Market Analysis (Pie) 8 4.2 Target Market Segment Strategy 8 4.3 Industry Analysis 8 4.3.1 Competition and Buying Patterns 9 5.0 Web Plan Summary 9 5.1 Website Marketing Strategy 9 5.2 Development Requirements 9 6.0 Strategy and Implementation Summary 9 6.1 SWOT Analysis 10 6.1.1 Strengths 12 6.1.2 Weaknesses 12 6.1.3 Opportunities 12 6.1.4 Threats 12 6.2 Competitive Edge 12 6.3 Marketing Strategy 12 6.4 Sales Strategy 13 6.4.1 Sales Forecast 13 Table: Sales Forecast 14 Chart: Sales Monthly 15 Chart: Sales by Year 16 6.5 Milestones 16 Table: Milestones 16 7.0 Management Summary 17 7.1 Personnel Plan 17 Table: Personnel 17 8.1 Important Assumptions 18 8.2 Break-even Analysis 18 Table: Break-even Analysis 19 8.3 Projected Profit and Loss 19 Table: Profit and Loss 20 Chart: Profit Monthly 21 Chart: Profit Yearly 21 Chart: Gross Margin Monthly 22 Chart: Gross Margin Yearly 22 8.4 Projected Cash Flow 23 Table: Cash Flow 23 Table: Cash Flow (Continued) 24 Chart: Cash 24 8.5 Projected Balance Sheet 25 Table: Balance Sheet 25 8.6 Business Ratios 25 Table: Ratios 26 Table: Sales Forecast 1 Table: Personnel 2 Table: Profit and Loss 3 Table: Cash Flow 4 Table: Balance Sheet 5 1.0 Executive Summary [YOUR COMPANY NAME] was formed in 1996 by [YOUR NAME] in [YOUR STATE/PROVINCE]. [YOUR COMPANY NAME]'s patented eco-safe INSERT PATTENED PRODUCT helps INSERT THE PURPOSE OF PRODUCT. [YOUR NAME], after completing research through patenting through full regulatory compliance now needs the resources to attain market exposure, acceptance and demand, so factories and their dealers make the "market ready products." [YOUR COMPANY NAME] envisions a collaborative effort with its factories and their dealers toward compatible goals in the agriculture trade. EXPLAIN PATTENED PRODUCT BENEFITS, ADVANTAGES, AND IMPORTANCE TO ITS INDUSTRY The focus of this business plan is to put forth objectives to work efficiently and effectively and expand internal operations, giving the Company the opportunity to grow. [YOUR COMPANY NAME] is ready to elevate to the next step(s). The Company is seeking grant funding in the amount of $1,000,000. The grant funding will be used to launch its sales and marketing phase of its business, to benefit all peoples' environments and needs worldwide. Chart: Highlights 1.1 Objectives [YOUR COMPANY NAME]'s objectives are: 1. To attain visibility of [YOUR COMPANY NAME]'s additive via typical media tools but specific to the Agricultural community 2. Pull through marketing to farmers. 3. Media presence in National and World Ag. publications, high class Web Site and Face book 4. Select regional and national distributors who promote and market to dealers 1.2 Mission [YOUR COMPANY NAME]'s Mission is to provide all the world's crop plants with [YOUR NAME]'s additive. INSERT REST OF MISSION STATEMENT. 1.3 Keys to Success [YOUR COMPANY NAME]'s keys to success are: 1. Attain visibility of the availability of [YOUR NAME]'s additive for the Agricultural community and the recognition the users will attain as better stewards of the environment 2. Highly trained sales agents in key markets 3. Personal relationship with major fertilizer producers and their farm service dealers 4. Patent protection for marketers of [YOUR NAME]'s additive 5. Demonstration sales via agricultural dealers to farms as sales training for showing yield benefits to farms from complying with environmental laws 2.0 Company Summary [YOUR COMPANY NAME] Owner: [YOUR NAME] [YOUR ADDRESS] Phone: [YOUR PHONE NUMBER] Email: [YOUREMAIL@YOURCOMPANY.COM] [YOUR COMPANY NAME]'s patented product is the DESCRIBE PATTENED PRODUCT. INSERT COMPANY'S BACKGROUND 2.1 Company Ownership [YOUR COMPANY NAME] is an INSERT LOCATION C-Corporation formed by [YOUR NAME]. The Company was incorporated in 1996. It is 100% controlled by [YOUR NAME]. [YOUR NAME] is responsible for all administrative and operational aspects of [YOUR NAME]'s business. 2.2 Company History INSERT HISTORY Table: Past Performance Past Performance 2008 2009 2010 Estimated Sales $14,538 $7,800 $26,250 Gross Margin $5,151 $2,764 $9,301 Gross Margin % 35.43% 35.44% 35.43% Operating Expenses $38,635 $19,042 $25,560 Balance Sheet 2008 2009 2010 Current Assets Cash $0 $35 $35 Other Current Assets $0 $18,000 $6,750 Total Current Assets $0 $18,035 $6,785 Long-term Assets Long-term Assets $0 $288,682 $288,682 Accumulated Depreciation $0 $91,399 $102,943 Total Long-term Assets $0 $197,283 $185,739 Total Assets $0 $215,318 $192,524 Current Liabilities Accounts Payable $0 $1,057 $1,418 Current Borrowing $0 $0 $0 Other Current Liabilities (interest free) $0 $744,169 $737,273 Total Current Liabilities $0 $745,226 $738,691 Long-term Liabilities $0 $0 $0 Total Liabilities $0 $745,226 $738,691 Paid-in Capital $0 $1,000 $1,000 Retained Earnings $0 ($514,630) ($530,908) Earnings $0 ($16,278) ($16,259) Total Capital $0 ($529,908) ($546,167) Total Capital and Liabilities $0 $215,318 $192,524 Other Inputs Payment Days 0 30 30 Chart: Past Performance 3.0 Products So far, [YOUR COMPANY NAME]'s work has resulted in a new product. DESCRIBE PRODUCT AND ITS USE 4.0 Market Analysis Summary The United States Department of Agriculture (USDA) reports (August 10, 2010 www.ers.usda.gov/Data/AgProductivity/ ) the following: "It is widely agreed that increased productivity is the main contributor to economic growth in U.S. agriculture. This data set provides estimates of productivity growth in the U.S. farm sector for the 1948-2008 period, and estimates of the growth and relative levels of productivity across the States for the period 1960-2004. The level of U.S. farm output in 2008 was 158 percent above its level in 1948, growing at an average annual rate of 1.58 percent. Aggregate input use increased a mere 0.06 percent annually, so the positive growth in farm sector output was very substantially due to productivity growth. This contrasts with a 3.6-percent annual output increase in the private nonfarm sector, with productivity growth accounting for a little more than a third of the economic growth. But what exactly is productivity? Single-factor measures of productivity, such as corn production per acre (yield or land productivity) or per hour of labor (labor productivity); have been used for many years because the underlying data are often easily available. While useful, such measures can also mislead. For example, yields could increase simply because farmers are adding more of other inputs, such as chemicals, labor, or machinery, to their land base
Easily Create Any Business Document You Need in Minutes.

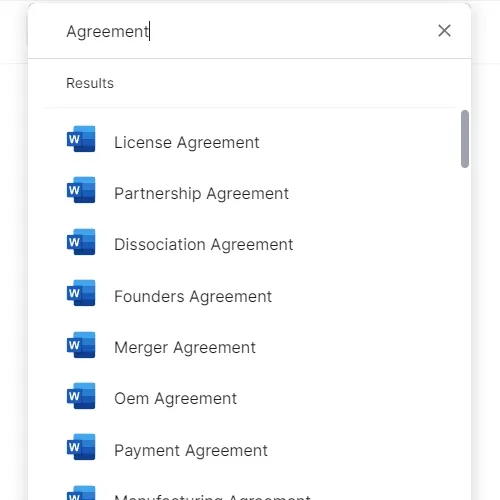
Download or open template
Access over 3,000+ business and legal templates for any business task, project or initiative.

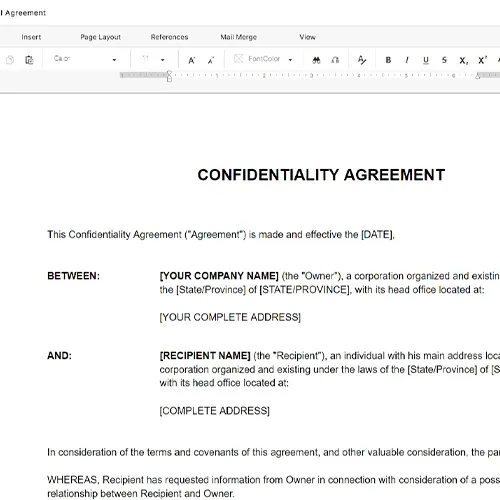
Edit and fill in the blanks
Customize your ready-made business document template and save it in the cloud.

Save, Share, Export, or Sign
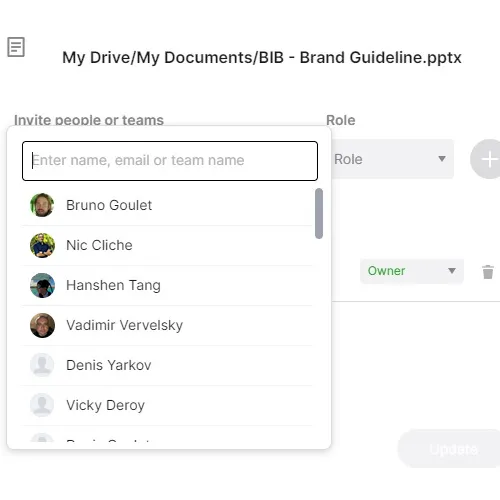
Share your files and folders with your team. Create a space of seamless collaboration.


